Electronic Systems Technology, Inc. (ELST)
ELST Stock Price Chart
Explore Electronic Systems Technology, Inc. interactive price chart. Choose custom timeframes to analyze ELST price movements and trends.
ELST Company Profile
Discover essential business fundamentals and corporate details for Electronic Systems Technology, Inc. (ELST) to support your stock research and investment decisions.
Sector
Technology
Industry
Communication Equipment
IPO Date
17 Mar 1999
Employees
8.00
Website
https://www.esteem.comCEO
Daniel M. Tolley
Description
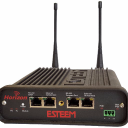
Electronic Systems Technology, Inc., doing business as ESTeem Wireless Modems, designs, develops, manufactures, and markets industrial wireless products and accessories in the United States and internationally. The company's ESTeem industrial wireless products provide communication links between computer networks, network enabled devices, and mobile devices without cables. It also offers data radio products for process automation in commercial, industrial, and government arenas, as well as various accessories, such as antennas, power supplies, and cable assemblies. In addition, the company provides repair and upgrade services; and professional services, such as site survey testing, system start-up, and custom engineering. Its products are used in various applications, including water/wastewater, oil/gas, mining, and industrial automation. The company markets its products through direct sales, sales representatives, resellers, and system integrators. Electronic Systems Technology, Inc. was founded in 1982 and is based in Kennewick, Washington.
ELST Financial Timeline
Browse a chronological timeline of Electronic Systems Technology, Inc. corporate events including earnings releases, dividend announcements, and stock splits.
Earnings released on 29 Oct 2024
EPS came in at -$0.01, while revenue for the quarter reached $148.51K.
Earnings released on 23 Jul 2024
EPS came in at -$0.01, while revenue for the quarter reached $333.57K.
Earnings released on 22 Apr 2024
EPS came in at -$0.02, while revenue for the quarter reached $356.06K.
Earnings released on 8 Mar 2024
EPS came in at -$0.01, while revenue for the quarter reached $311.81K.
Earnings released on 25 Oct 2023
EPS came in at -$0.01, while revenue for the quarter reached $342.72K.
Earnings released on 27 Jul 2023
EPS came in at $0.01, while revenue for the quarter reached $585.21K.
Earnings released on 28 Apr 2023
EPS came in at -$0.02, while revenue for the quarter reached $305.09K.
Earnings released on 15 Mar 2023
EPS came in at $0.01, while revenue for the quarter reached $533.87K.
Earnings released on 28 Oct 2022
EPS came in at $0.01, while revenue for the quarter reached $487.16K.
Earnings released on 9 Aug 2022
EPS came in at -$0.00, while revenue for the quarter reached $472.14K.
Earnings released on 9 Aug 2022
EPS came in at -$0.00, while revenue for the quarter reached $416.89K.
Earnings released on 4 Mar 2022
EPS came in at -$0.01, while revenue for the quarter reached $374.18K.
Earnings released on 29 Oct 2021
EPS came in at $0.00, while revenue for the quarter reached $256.07K.
Earnings released on 28 Jul 2021
EPS came in at $0.03, while revenue for the quarter reached $457.00K.
Earnings released on 28 Jul 2021
EPS came in at $0.03, while revenue for the quarter reached $424.78K.
Earnings released on 8 Mar 2021
EPS came in at $0.02, while revenue for the quarter reached $503.04K.
Earnings released on 26 Oct 2020
EPS came in at -$0.02, while revenue for the quarter reached $202.87K.
Earnings released on 31 Jul 2020
EPS came in at -$0.02, while revenue for the quarter reached $245.50K.
ELST Stock Performance
Access detailed ELST performance analysis with candlestick charts, real‑time intraday data and historical financial metrics for comprehensive insights.
Explore Related Stocks
Compare companies within the same sector by viewing performance, key financials, and market trends. Select a symbol to access the full profile.