Scientific Industries, Inc. (SCND)
SCND Stock Price Chart
Explore Scientific Industries, Inc. interactive price chart. Choose custom timeframes to analyze SCND price movements and trends.
SCND Company Profile
Discover essential business fundamentals and corporate details for Scientific Industries, Inc. (SCND) to support your stock research and investment decisions.
Sector
Technology
Industry
Hardware, Equipment & Parts
IPO Date
4 Apr 1994
Employees
61.00
CEO
Helena R. Santos CPA
Description
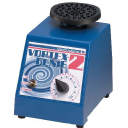
Scientific Industries, Inc. designs, manufactures, and markets benchtop laboratory equipment and bioprocessing systems worldwide. It offers vortex mixers to mix the contents of test tubes, beakers, and other containers by placing such containers on a rotating cup or other attachments; and various mixers and shakers, such as high speed touch mixers, mixers with an integral timer, cell disruptors, microplate mixers, vortex mixers incorporating digital control and display, multi-vessel vortex mixers, and orbital shakers. The company also provides benchtop multi-purpose rotators and rockers to rotate and rock various containers; refrigerated incubators and incubated shakers for shaking and stirring functions; and magnetic stirrers, including high/low programmable magnetic stirrers, four-place high/low programmable magnetic stirrers, large volume magnetic, and four-place general purpose stirrers. In addition, it offers bioprocessing systems comprising disposable sensors, such as coaster systems and other shaking products using vessels; and mechanical balances, moisture analyzers, pill counters, test stands, and force gauges, as well as pharmacy, laboratory, and industrial digital scales. The company's products are used for research purposes by universities, pharmaceutical companies, pharmacies, national laboratories, medical device manufacturers, petrochemical companies, and other industries performing laboratory-scale research. The company markets its products under the Genie and Torbal brand names directly, as well as through laboratory equipment distributors and online. Scientific Industries, Inc. was incorporated in 1954 and is headquartered in Bohemia, New York.
SCND Financial Timeline
Browse a chronological timeline of Scientific Industries, Inc. corporate events including earnings releases, dividend announcements, and stock splits.
Upcoming earnings on 13 Nov 2025
Upcoming earnings on 13 Aug 2025
Earnings released on 31 Mar 2025
EPS came in at -$0.18.
Earnings released on 28 Mar 2025
Earnings released on 14 Nov 2024
EPS came in at -$0.11.
Earnings released on 14 Aug 2024
Earnings released on 15 May 2024
EPS came in at -$0.20.
Earnings released on 29 Mar 2024
EPS came in at -$0.22, while revenue for the quarter reached $2.74M.
Earnings released on 14 Nov 2023
EPS came in at -$0.31, while revenue for the quarter reached $2.59M.
Earnings released on 14 Aug 2023
EPS came in at -$0.33, while revenue for the quarter reached $2.98M, beating expectations by +7.40%.
Earnings released on 16 May 2023
EPS came in at -$0.34 falling short of the estimated -$0.29 by -17.24%, while revenue for the quarter reached $2.67M, missing expectations by -3.85%.
Earnings released on 17 Feb 2023
EPS came in at -$0.40, while revenue for the quarter reached $2.57M, missing expectations by -7.53%.
Earnings released on 15 Nov 2022
EPS came in at -$0.18 surpassing the estimated -$0.33 by +45.45%, while revenue for the quarter reached $2.86M, beating expectations by +14.60%.
Earnings released on 28 Sept 2022
EPS came in at -$0.29, while revenue for the quarter reached $2.78M, meeting expectations.
Earnings released on 17 May 2022
EPS came in at -$0.23 surpassing the estimated -$0.30 by +23.33%, while revenue for the quarter reached $2.86M, missing expectations by -7.58%.
Earnings released on 16 Feb 2022
EPS came in at -$0.14 surpassing the estimated -$0.29 by +51.72%, while revenue for the quarter reached $2.90M, missing expectations by -3.19%.
Earnings released on 16 Nov 2021
EPS came in at -$0.19 surpassing the estimated -$0.33 by +42.42%, while revenue for the quarter reached $2.85M, missing expectations by -4.85%.
Earnings released on 14 Oct 2021
EPS came in at -$0.36 surpassing the estimated -$0.66 by +45.45%, while revenue for the quarter reached $2.53M, missing expectations by -6.29%.
Earnings released on 17 May 2021
EPS came in at -$0.51 falling short of the estimated -$0.27 by -88.89%, while revenue for the quarter reached $2.51M, beating expectations by +14.03%.
Earnings released on 23 Feb 2021
EPS came in at -$0.05 surpassing the estimated -$0.47 by +89.36%, while revenue for the quarter reached $2.72M, beating expectations by +35.87%.
Earnings released on 23 Nov 2020
EPS came in at -$0.09 surpassing the estimated -$0.36 by +75.00%, while revenue for the quarter reached $2.16M, missing expectations by -36.51%.
Earnings released on 9 Oct 2020
EPS came in at -$0.21, while revenue for the quarter reached $1.92M.
SCND Stock Performance
Access detailed SCND performance analysis with candlestick charts, real‑time intraday data and historical financial metrics for comprehensive insights.
Explore Related Stocks
Compare companies within the same sector by viewing performance, key financials, and market trends. Select a symbol to access the full profile.